Relative Strength Index (RSI)
The Relative Strength Index, or RSI, is a momentum indicator. Rather than tracking every price move candle by candle, it condenses recent buying and selling pressure into a single number between 0 and 100, something you can read at a glance instead of piecing together yourself. It was introduced by J. Welles Wilder in 1978 and has stayed one of the most used momentum indicators since.
It works by comparing the size of recent up candles to the size of recent down candles over a chosen period, 14 by default. When gains have been outweighing losses, RSI climbs toward 100. When losses have been outweighing gains, it drops toward 0. The number describes what has already happened, it does not predict what happens next.
Three zones are worth knowing:
Example
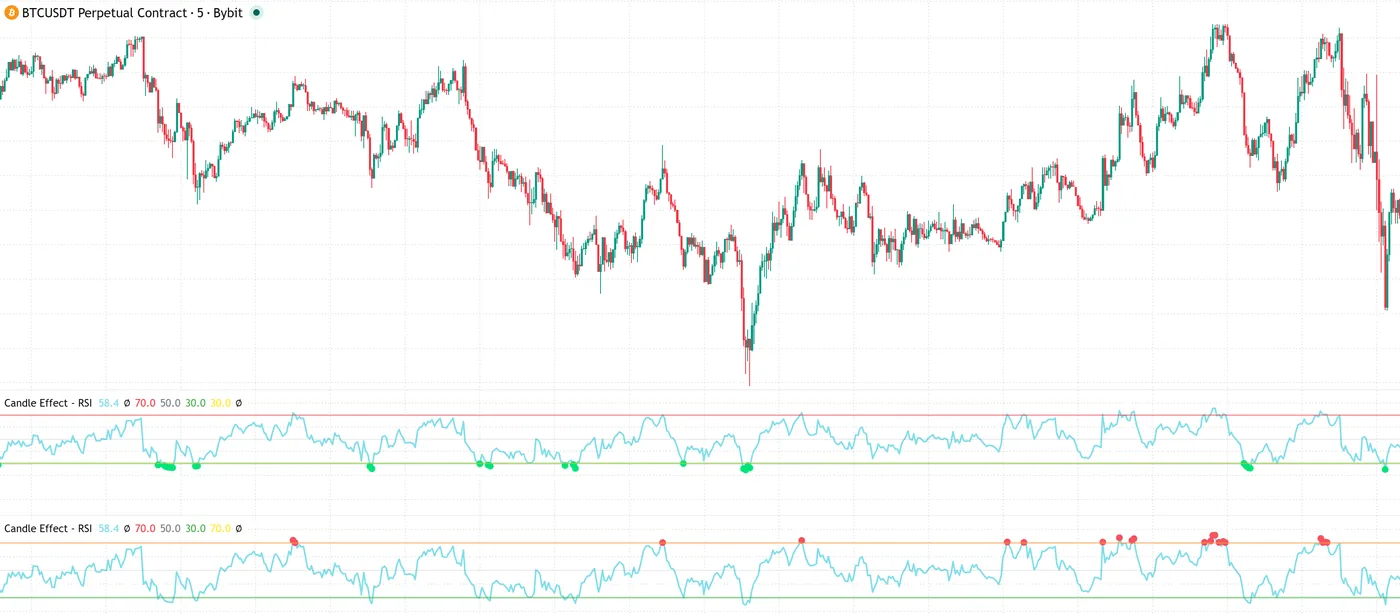
Settings
Choosing a period
14 is the default here and the most widely used setting, but it is a starting point, not a fixed rule. The period controls how many candles RSI looks back over, and changing it changes how fast the line reacts.
A shorter period reacts quickly, which is why it shows up on very short timeframes like 1-minute or 5-minute charts. It catches short bursts of momentum fast, at the cost of more noise and more false starts.
The standard setting, and the one used across this site. It balances responsiveness against noise, quick enough to catch real shifts without overreacting to every small wiggle.
A longer period smooths the line out further. It reacts more slowly and filters out short-term noise, which is why it tends to show up on longer, swing-style timeframes where the focus is the bigger trend.
The same setting also behaves differently depending on the chart. A 14-period RSI on a 1-minute chart swings around far more than the same 14-period RSI on a daily chart, simply because short timeframes carry more noise. There is no single correct setting for everyone, it depends on the timeframe and instrument being watched. Shorter periods highlight quick shifts, longer periods reveal the broader trend.
Keeping it in context
RSI is one piece of information, not a full trading plan on its own. It is usually read alongside price action, trend direction, or other indicators rather than in isolation. This page covers what RSI is and how to read it, the panels above show how it is configured inside this indicator specifically.
Backtesting and performance stats
Before using any RSI-based setup, it helps to test it against historical data first, a process usually called backtesting. It cannot tell you what happens next, but it shows how a setup would have behaved across different market conditions in the past. Strategy Lab, our own tester, is built for exactly this, running a setup against historical candles before it goes anywhere near a live account.
RSI tends to hold up better in ranging markets, where price moves back and forth between clear levels. Buying when RSI drops below 30 and selling when it rises above 70 can work reasonably well there. In a strong trend, the same signals get less reliable, RSI can sit above 70 for a long stretch while price keeps climbing, so selling every time it crosses 70 can mean exiting a move far too early, again and again.
The RSI 7, 14, and 21 settings covered above will not just look different on the chart, they will backtest differently too. A shorter period produces more signals along with more false ones. A longer period gives fewer, smoother signals. Which one holds up best depends on the market, the timeframe, and the asset being tested, there is no setting that wins everywhere.
Backtesting will not guarantee future results, markets change. But it turns an idea into something you can actually look at instead of a guess, and running it through Strategy Lab before relying on it anywhere live is the more careful way to find out whether it holds up.