Stochastic Oscillator
The Stochastic Oscillator is a momentum indicator, and it asks one simple question: where does the current close sit inside the recent high to low range? If price closes right at the top of that range the reading is 100, right at the bottom and it is 0. It was developed by George Lane in the 1950s and has been in use ever since.
That makes it different from RSI even though both run on a 0 to 100 scale. RSI compares the size of recent gains against recent losses. Stochastic ignores size entirely and only cares about position: not how hard price moved, but where it finished relative to where it has been.
It draws two lines rather than one. %K is the reading itself, and %D is an average of %K, so %D is smoother, turns later, and never reaches quite as far. Where they cross is the thing the indicator is best known for.
Three zones are worth knowing:
How the number is worked out
The arithmetic is short enough to follow by hand, and seeing it once makes everything below easier to read. Take the highest high and the lowest low over the lookback period, then work out where the current close sits between the two.
Say the lookback covers 13 candles, the highest high across them is 150, the lowest low is 125, and price has just closed at 145. The full range is 25 points, and the close sits 20 points up from the bottom of it. 20 divided by 25 is 0.8, so the reading is 80. Price closed four fifths of the way up its recent range.
That is the raw figure, and on its own it is very jumpy. %K Smoothing averages it before it is drawn, and %D averages %K a second time, which is why the two lines on a chart move more gently than the bare calculation does.
One thing worth noticing in that formula: the reading is a position, not a distance. A close at the exact top of the lookback returns 100 outright, however large or small that range happens to be, and a close at the exact bottom returns 0 the same way. That is why the raw figure sits at its limits far more readily than a measure built on the size of a move would, and it is also why the smoothing settings matter as much as they do here: they temper that behaviour rather than remove it.
Example
Settings
Compares the %K line against the number in the Value field. Four options, and the difference between the first two and the last two is whether they describe a state or a moment.
This one ignores the Value field entirely. Instead of comparing %K to a number, it compares the two lines to each other, which is the crossover stochastic is best known for. Because %K is the faster line and %D is an average of it, a crossover is %K pulling away from its own recent average, which is why it gets read as the point where momentum changed rather than as a level being reached.
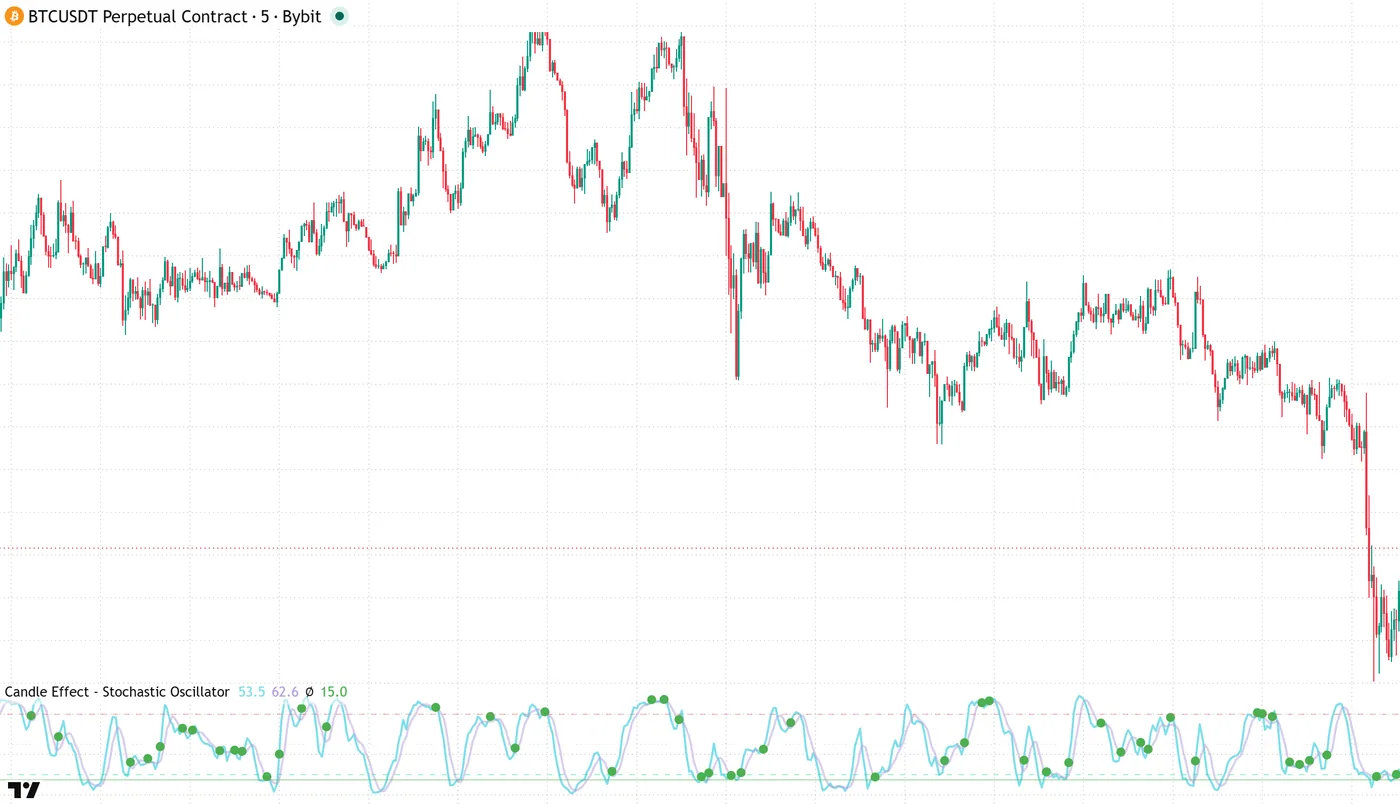
The two conditions work together, so both have to be satisfied on the same candle. The settings shown above are an example of why that is useful: on its own, %K crossing up through %D fires wherever it happens, including at the very bottom of the range. Pairing it with %K Greater Than 15 keeps the crossover requirement but ignores the ones that occur while the reading is still at the floor. Setting K vs D Condition to Any removes the crossover requirement and leaves the %K Condition working alone.
Choosing a period
Stochastic takes three numbers rather than one. %K Length sets how many candles the high to low range is measured over, and the two smoothing values control how much each line is averaged before being drawn. 14, 3, 3 is the textbook starting point. The values shown in the panels above, 13, 4, 2, are what this indicator ships with, and they are what the example chart is drawn from.
The lookback. A shorter length measures against a narrower slice of recent price, so the reading reaches the extremes far more often. A longer one asks where price sits within a wider stretch of history, which moves more slowly.
How much the raw reading is averaged before it is drawn. Raw stochastic is very jumpy, so this is usually set to 3 rather than 1. A setting of 1 gives the original fast stochastic, which most people find too noisy to read.
How heavily %D is averaged from %K. A larger number makes %D slower and lags it further behind, which spaces the two lines further apart and changes where they cross.
Whichever combination you settle on, expect this indicator to spend more time at its extremes than RSI does, for the reason set out further up: it reports a position inside a range, so the ends of that range are reachable by definition. Heavier smoothing tempers it without removing it. That is normal behaviour rather than a fault, but it is why a reading at the top here does not carry the same meaning as the same number would on RSI.
Divergence
Divergence is the name for price and the oscillator disagreeing with each other.
If price makes a lower low than the low before it, but the oscillator's matching low comes in higher than its previous one, then price reached further down while the momentum behind the move did not. That is a bullish divergence. The mirror image, price making a higher high while the oscillator makes a lower high, is a bearish divergence.
George Lane treated this as the most important thing the indicator showed, ahead of the overbought and oversold readings that most people reach for first. It is worth knowing what the pattern is called and what it describes. It is also worth knowing that it settles nothing on its own: divergence can persist for a long stretch, and it can resolve by the oscillator catching back up to price rather than by price turning around.
Keeping it in context
The Stochastic Oscillator is one piece of information, not a full trading plan on its own. It is usually read alongside price action, trend direction, or other indicators rather than in isolation. This page covers what it is and how to read it, the panels above show how it is configured inside this indicator specifically.
It also produces signals that lead nowhere. The reading can pass through a level, or the two lines can cross each other, with price doing nothing afterwards, and in choppy or fast moving conditions that happens often. That is a normal property of the indicator rather than a fault in it, and it is the usual reason a reading gets checked against something else, the direction of the wider trend for instance, before it is treated as meaningful.
Backtesting and performance stats
Before using any setup built on this indicator, it helps to test it against historical data first, a process usually called backtesting. It cannot tell you what happens next, but it shows how a setup would have behaved across different market conditions in the past. Strategy Lab, our own tester, is built for exactly this, running a setup against historical candles before it goes anywhere near a live account.
Stochastic tends to hold up better in ranging markets, where price moves back and forth between clear levels and keeps returning to the middle of its range. In a strong trend it spends long stretches pinned at one end, so a setup that acts every time the reading passes 80 or 20 can end up firing over and over against a move that simply keeps going.
The three settings covered above will not just look different on the chart, they will backtest differently too. A shorter %K Length produces far more signals along with more false ones. Heavier smoothing gives fewer, cleaner signals but they arrive later. Which combination holds up best depends on the market, the timeframe, and the asset being tested, there is no setting that wins everywhere.
Backtesting will not guarantee future results, markets change. But it turns an idea into something you can actually look at instead of a guess, and running it through Strategy Lab before relying on it anywhere live is the more careful way to find out whether it holds up.