CANDLE EFFECT
TRADING SYSTEMS
School / Indicators
Indicators

Volume Weighted Average Price (VWAP)

VWAP is the average price an asset has traded at during a session, weighted by how much was traded at each price. A price where a lot of volume changed hands counts for more than one where very little did, so the line settles where most of the real business was done.

It starts again at the beginning of every period. Crypto never closes, so the period is set by time instead, a day, a week or a month, and the line builds up again from the first candle of each new one. On our indicator that choice is the Reset Period, weekly by default.

Read like that, VWAP answers one simple question: is price right now above or below what the average buyer paid today?

Above VWAP
Buyers have had the upper hand this session. Someone who bought at the day's average is sitting on a profit, which tends to give the price some support.
Below VWAP
Sellers have been in control. The average buyer from today is holding a loss, which tends to weigh on any bounce.
At VWAP
Price is sitting on the session's fair value, the level buyers and sellers have broadly agreed on so far.

Example

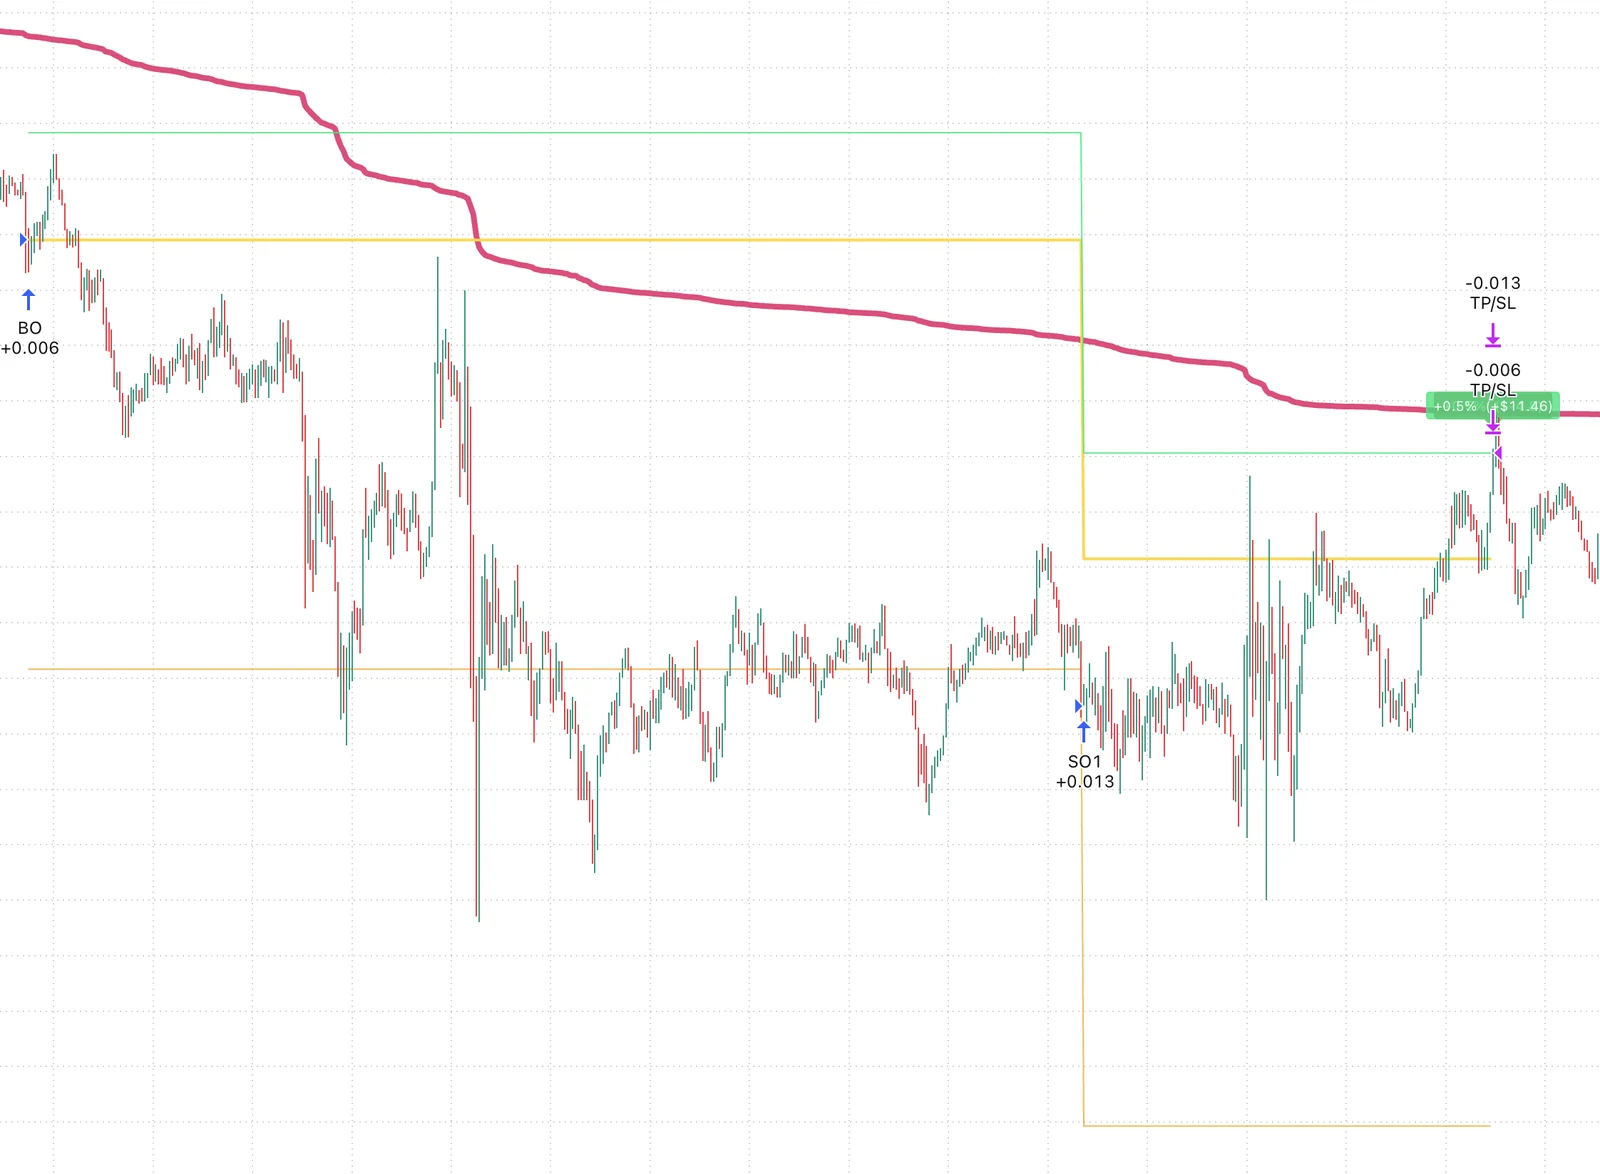
A long trade in Strategy Lab using the Candle Effect VWAP indicator. The base order and one safety order are filled while price trades well below the VWAP line, and the trade closes at a 0.5% take profit just under the line.

A long trade from Strategy Lab, with VWAP deciding the entries. Both orders came in while price was trading well below the line, first the base order (BO) and later the first safety order (SO1). The trade then closed at a fixed 0.5% take profit, just under VWAP.

Pink line
VWAP, on a weekly reset.
Yellow line
The average entry price. It drops after SO1 fills, because the second order was bought lower.
Green line
The take profit, 0.5% above the average entry, moving down with it.
Orange line
Where the next safety order would sit.

This was a very conservative exit. A fixed 0.5% closes the trade early and takes a small, quick profit. Another way to run the same trade is to wait for a minimum profit and then close on the indicator, once price closes back above the VWAP line. When price is being pulled back up toward VWAP, as it was here, that can leave far more of the move in the trade. It also keeps the position open for longer, so it only pays when price actually gets there.

Settings

VWAP settings
Reset PeriodWeekly
SD Band 1 Multiplier1
SD Band 2 Multiplier2
SD Band 3 Multiplier3
Show VWAP LineOn
Show SD BandsOn
Show Zone FillsOn
Signal settings
Zone / ConditionBelow -1 SD
Crossing OnlyOn
% Value2
Show Signal MarkersOn
Reset Period
When the line starts again. Daily, Weekly or Monthly restart it at the start of each day, week or month. Session follows the trading session of the symbol, and on crypto, which trades around the clock, that works out much the same as Daily.
SD Bands
Three bands above VWAP and three below it, set by the multipliers. Each one is a number of standard deviations away from the line, so they widen when price swings a lot around VWAP and tighten when it stays close. Zone Fills shade the space between them.
Below -1 to -3 SD
True while price is below that lower band.
Above +1 to +3 SD
True while price is above that upper band.
Cross Below VWAP
True only on the candle where price moves from above the VWAP line to below it.
Cross Above VWAP
True only on the candle where price moves from below the VWAP line to above it.
% Below VWAP
True while price is at least the % Value below the line. With 2, that means 2% or more under VWAP.
% Above VWAP
True while price is at least the % Value above the line.
Crossing Only
With it on, the signal fires once, on the candle where price first enters the zone. With it off, it stays true on every candle price spends there.

How the number is worked out

Every candle gets a typical price, the average of its high, low and close. That typical price is multiplied by the candle's volume. VWAP is the running total of those amounts, divided by the running total of volume since the session began.

VWAP = Σ (typical price × volume) ÷ Σ volume
typical price = (high + low + close) ÷ 3

Both totals keep growing through the session, so each new candle moves the line a little less than the one before it. Early in the day VWAP reacts quickly. By the evening it barely moves at all, which is worth remembering when you read it late in a session.

PRICEVOLUMENew session, VWAP starts againVWAPPullback to VWAP

What traders use it for

Trend

Above the line leans bullish, below leans bearish. It is a quick read on which side is in control, and it updates through the session as that balance shifts.

Support and resistance

The line itself often behaves like a level. Price coming back to it will frequently stall there or bounce off it, especially the first time it returns.

Getting a fair fill

Large buyers use it to judge their own execution. Buying below VWAP or selling above it means a better price than the session's average, and it keeps their orders from pushing the price away from fair value.

A common setup, the pullback

One of the simplest ways it gets traded: let VWAP decide the side, then wait for price to come back to the line before doing anything.

Long side
Price moves above VWAP, then pulls back toward it. The entry comes on the return to the line.
Short side
Price moves below VWAP, then rallies back up toward it. The entry comes on the return to the line.
Stop
Just beyond the line on the far side, so a clean break through VWAP ends the trade.
Target
Often the next standard deviation band away from VWAP, or a trailing stop when the move keeps running.

This shows how the setup is commonly traded, to explain what the indicator is for. It is not a recommendation to take any trade.

VWAP and a moving average

On a chart the two can look alike, but they are built differently. A simple moving average takes the closing prices over a fixed number of candles and averages them, treating every candle the same. VWAP weights each candle by its volume and starts over every session.

So a quiet candle barely moves VWAP, while on a moving average it counts exactly as much as a busy one. That makes VWAP the closer read of a single session, and a moving average the simpler tool for looking across several days.

Where it falls short

Early in the session
With only a few candles behind it, the line has very little to go on and can swing around a lot.
It lags as the day goes on
Every new candle is a smaller share of the total, so late in the session the line trails price and reacts slowly.
Strong trend days
Price can run away from VWAP and never come back. Waiting for a pullback to the line on a day like that can mean watching the whole move from the side.
It only looks back
VWAP is built entirely from trades that already happened. It shows where value has been and has no way of knowing where price goes next.
One session at a time
Stretching it across several days without a reset blends the sessions together and gives a misleading line.

Pairing it with other indicators

VWAP tells you where price sits against the day's value. Other indicators add timing and momentum, and that combination is usually where it earns its place.

With RSI
An RSI above 70 as price climbs into VWAP from below can mark a stall. An RSI below 30 as price drops into it from above can mark a floor.
With MACD
A bullish MACD crossover while price holds above VWAP puts two signals on the same side, and a bearish crossover below it does the same the other way.
With Bollinger Bands
Price reaching an outer Bollinger Band at the same moment as one of the VWAP bands is two separate measures of stretch agreeing with each other.

Keeping it in context

VWAP is a reference for the session, one input among several. It shows where the market has agreed on value today. Price action, the wider trend and your own risk rules decide what to do with that.

Backtesting and performance stats

Any VWAP rule is worth testing on historical data before you trust it. Strategy Lab, our own tester, runs a setup against past candles so you can see how it would have behaved across calm sessions and trending ones alike.

Backtesting will not guarantee future results, because markets change. What it does is turn an idea into something you can actually look at, before it goes anywhere near a live account.